Reports ready to present
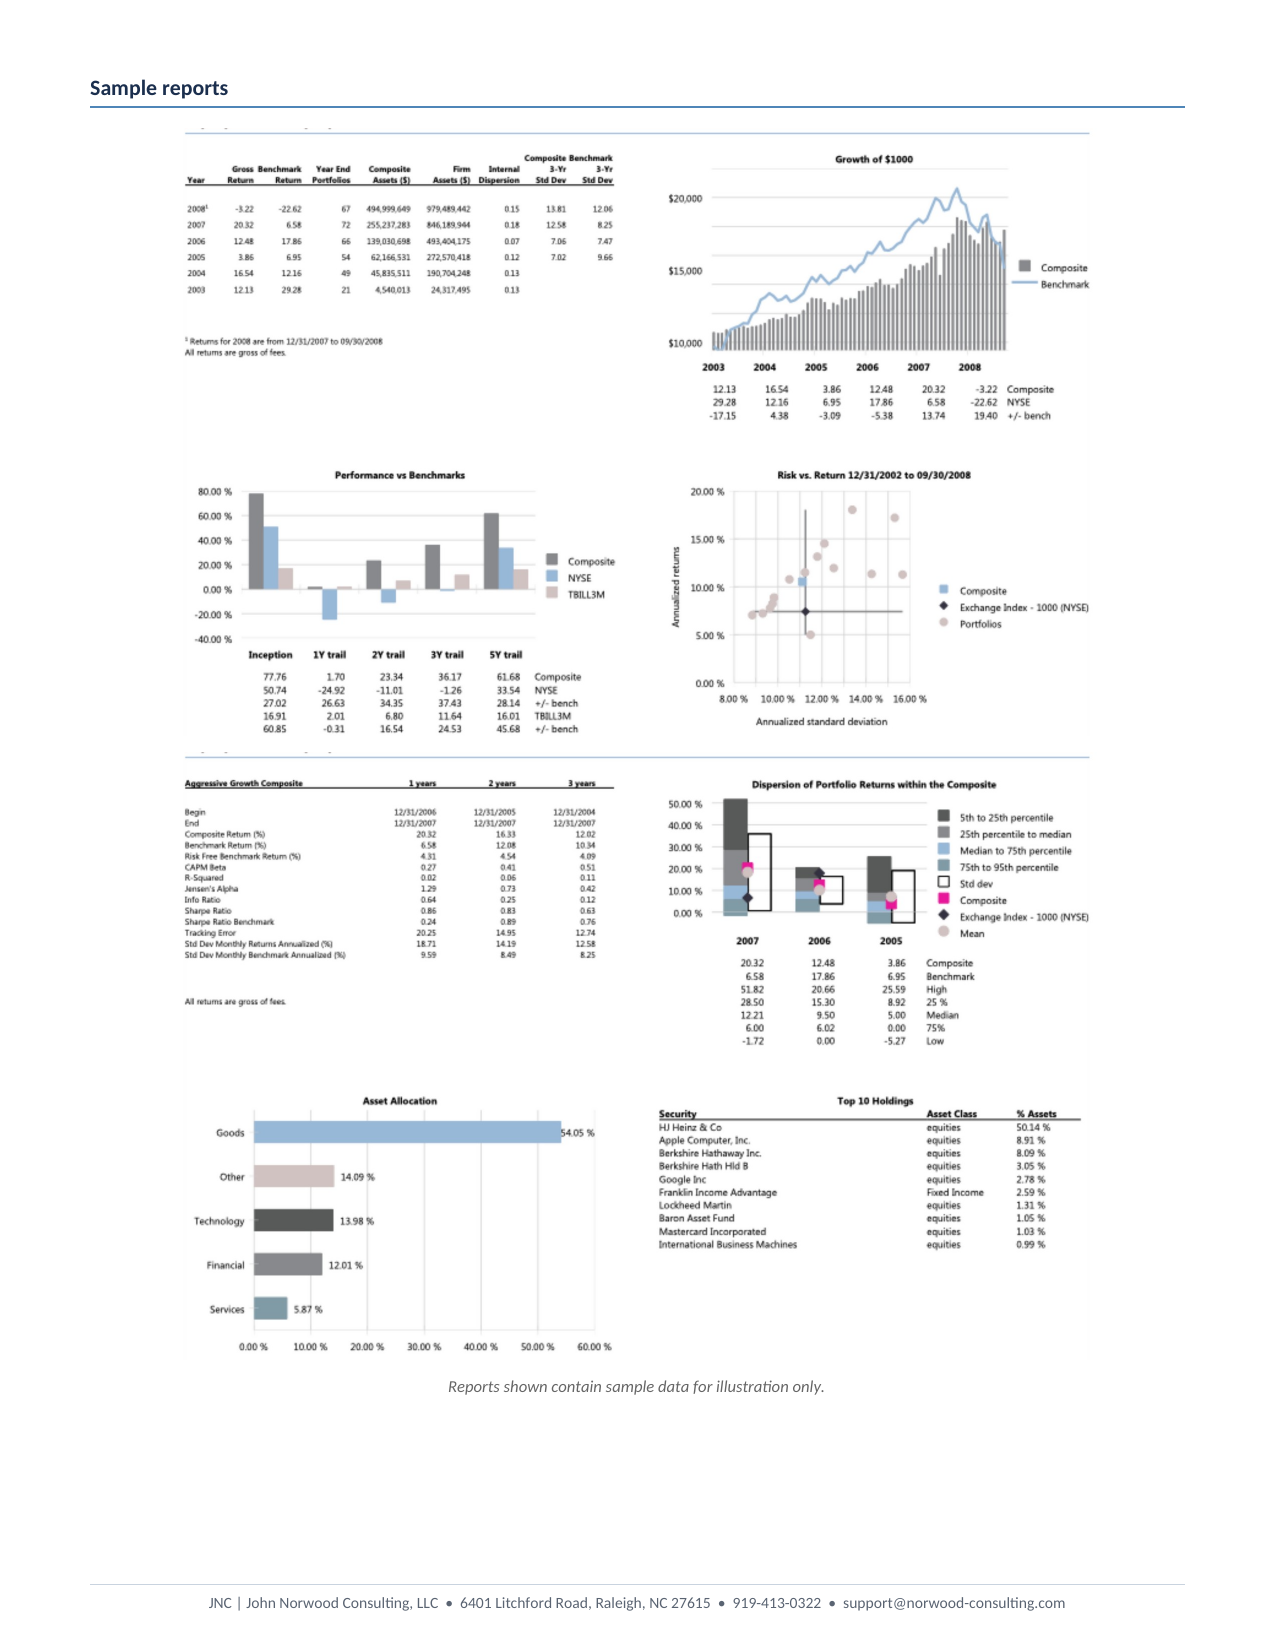
Built-in templates produce GIPS Reports and multi-period reporting with a broad set of return and risk analytics. Reports are saved to an archive, and charts export for use in presentations and pitch books.
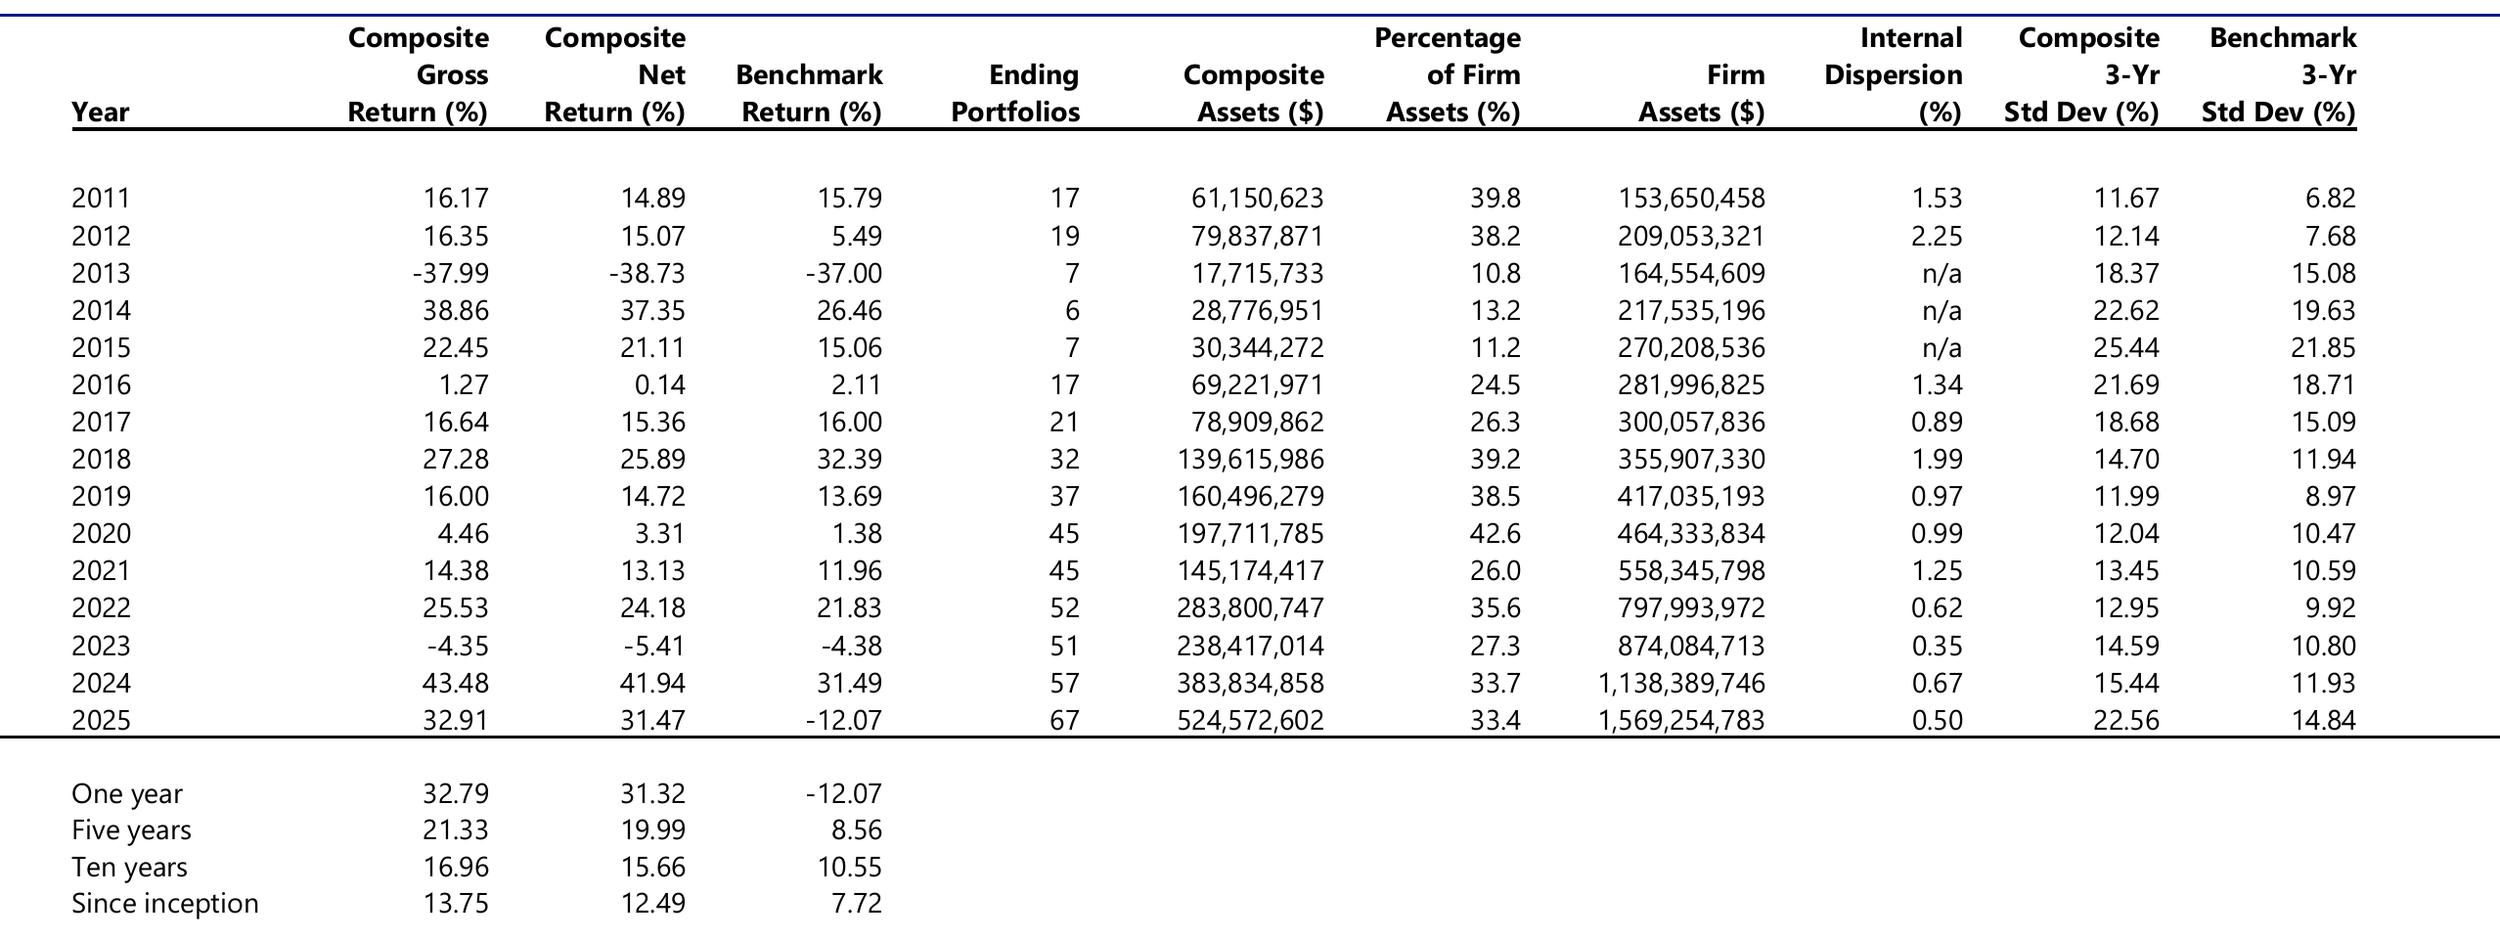
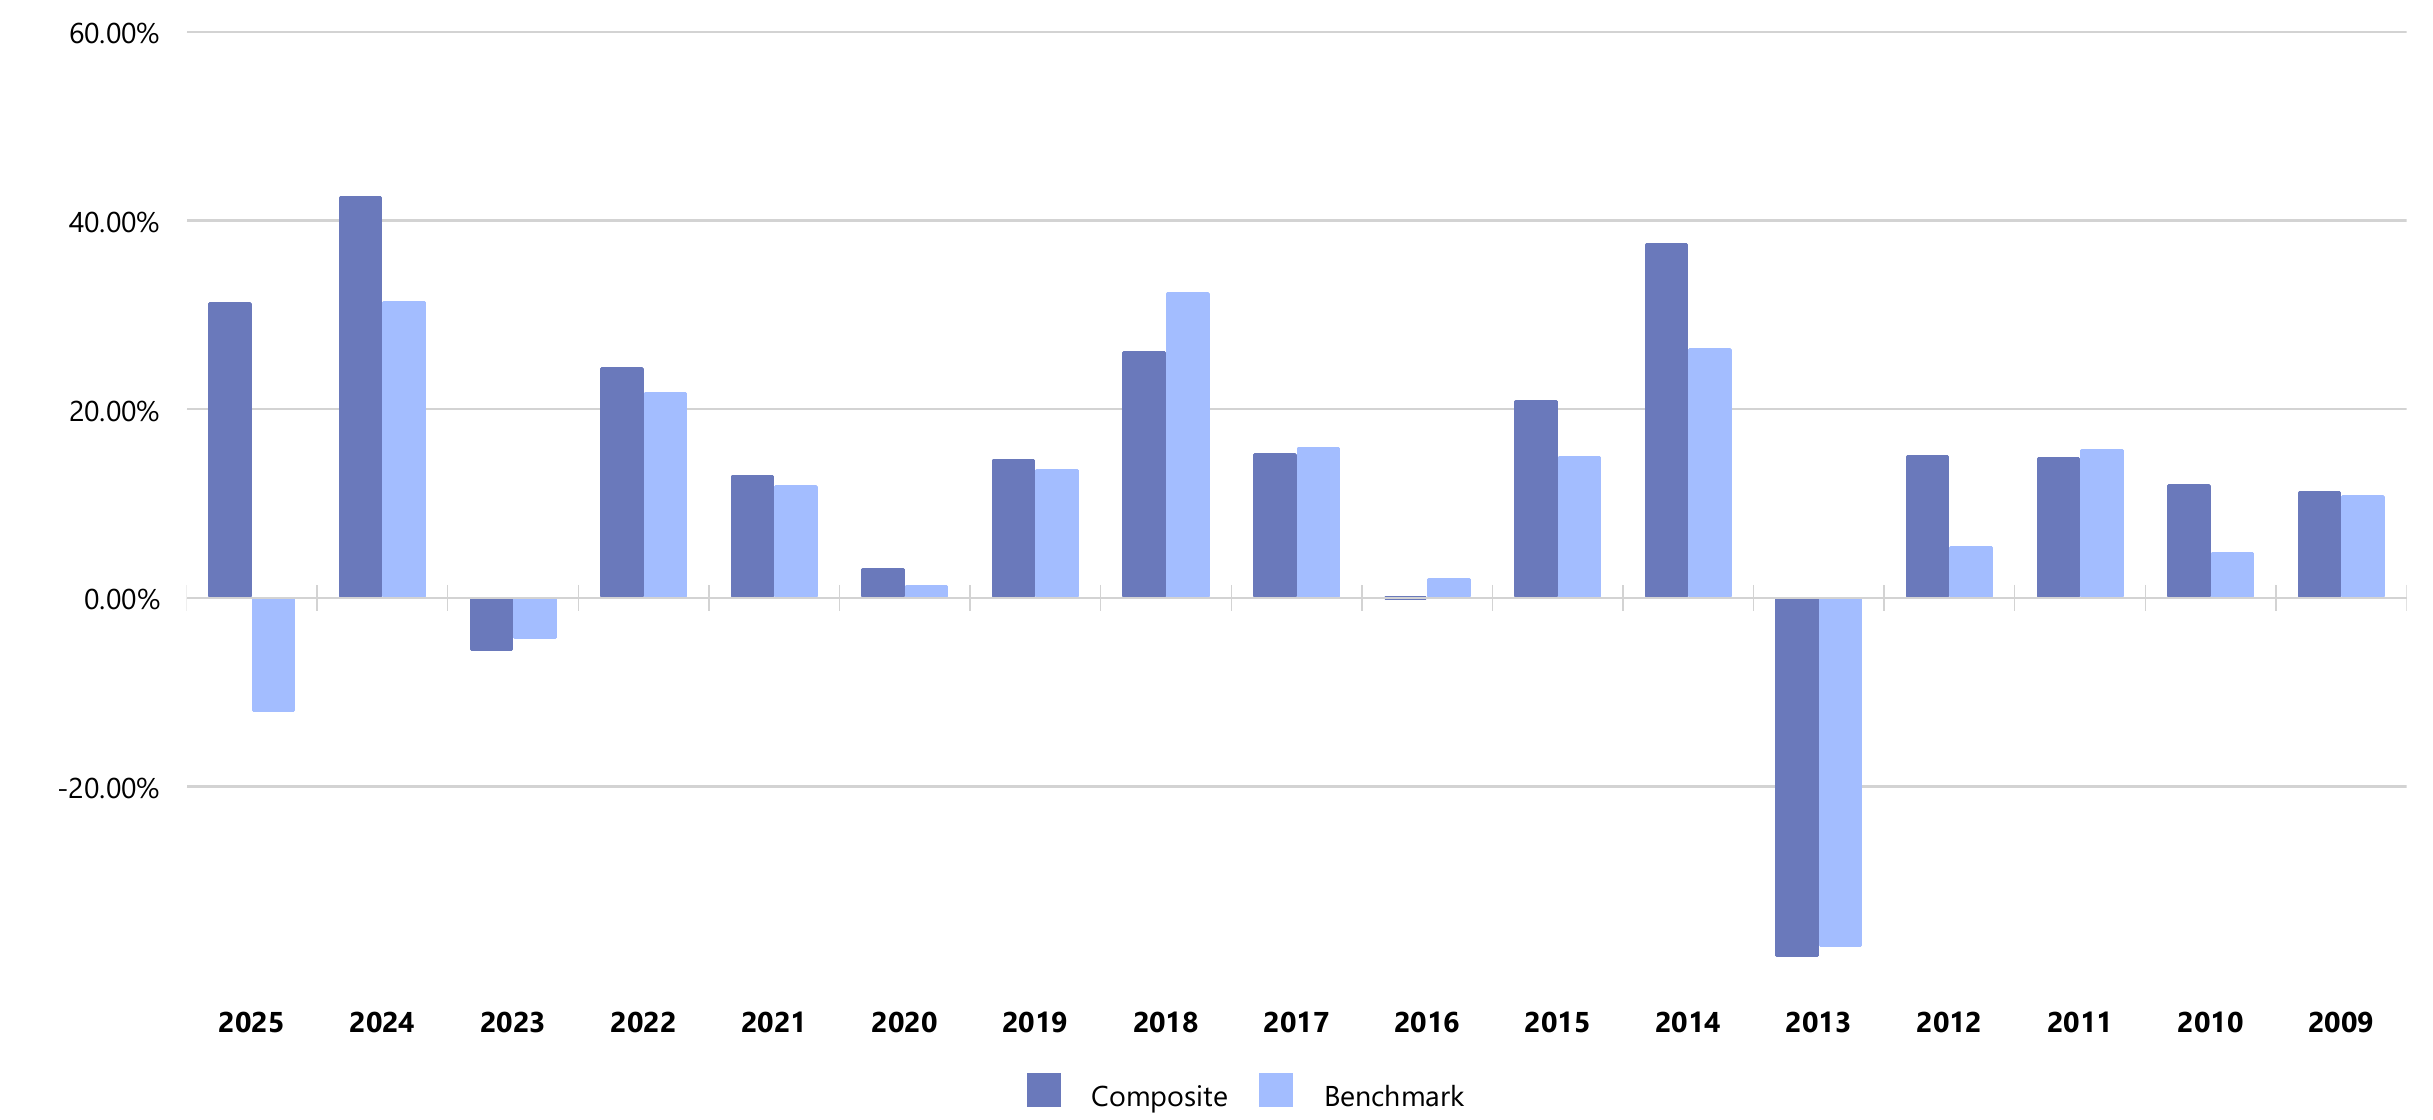
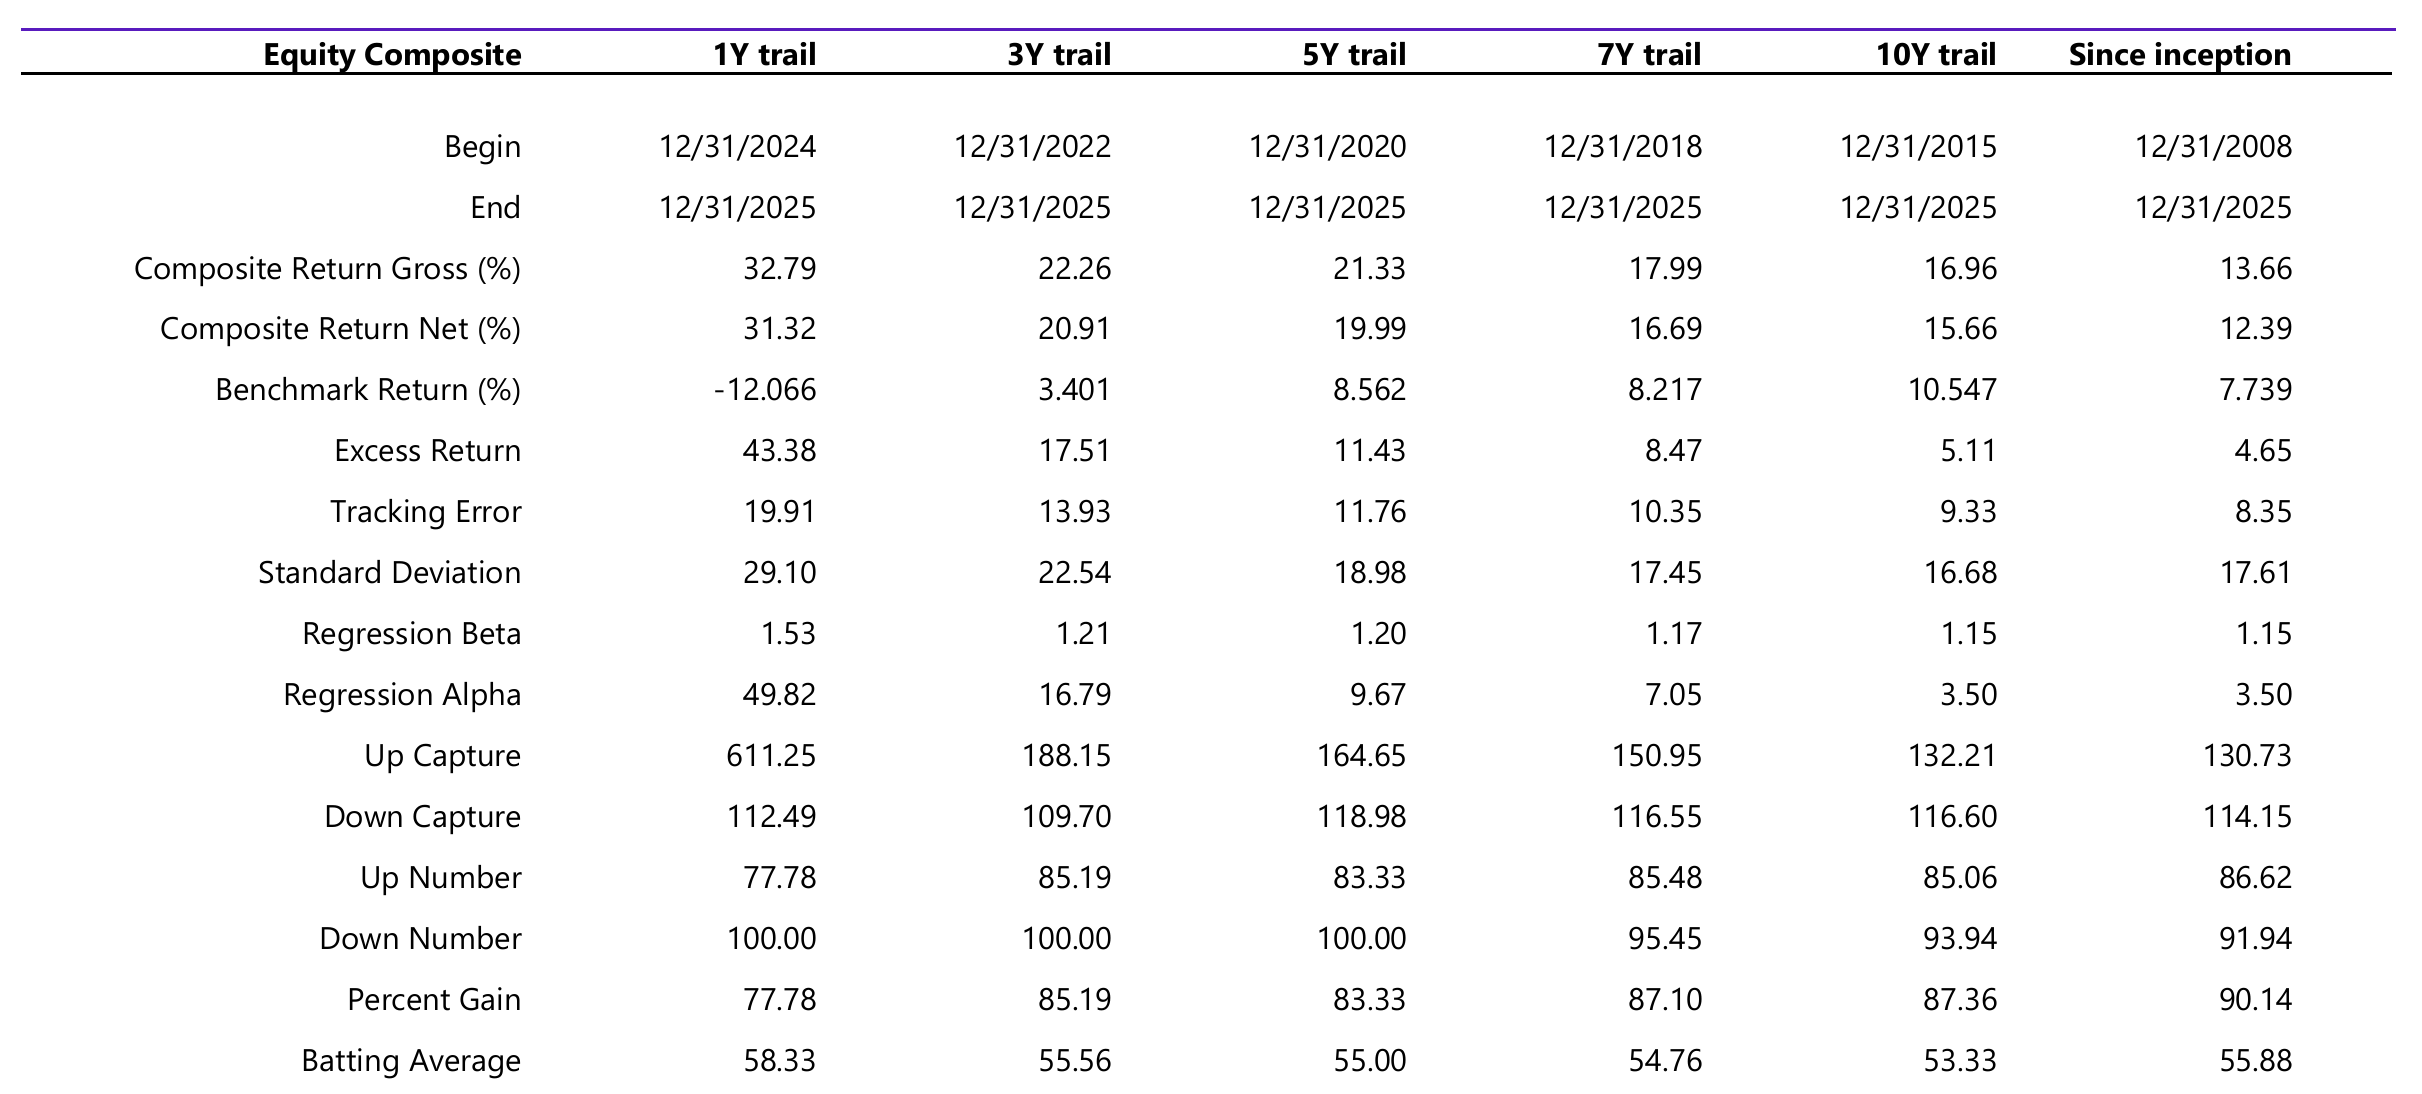
Shown below: a GIPS Composite Report with annual statistics and 1-, 5-, 10-year and since-inception returns; an annual composite performance vs. benchmark chart; and performance statistics across trailing periods.
All reports shown contain sample data for illustration only.
“We found CompositeBuilder to be a well-designed, user-friendly application with a short learning curve. The built-in audit checks and status reports support accurate record keeping and reporting. The standard suite of data extracts makes interaction with our independent verifier efficient. Support staff provided comprehensive guidance during the initial implementation and have been very responsive and accommodating to our needs.”
Risk measures
Sharpe ratio (geometric or arithmetic)
Alternative Sharpe ratio
Adjusted Sharpe ratio
Revised Sharpe ratio
Tracking error (geometric or arithmetic)
Excess return (geometric or arithmetic)
Information ratio (geometric or arithmetic)
Adjusted information ratio (geometric or arithmetic)
Relative Hurst index (geometric or arithmetic)
Regression statistics
Regression beta
Regression alpha
CAPM beta
Jensen’s alpha
R-squared
Specific risk
Systematic risk
Total risk
Treynor ratio (geometric or arithmetic)
Extreme risk
Ex-post VaR, 95% confidence (historical)
Ex-post VaR, 95% confidence (parametric)
Ex-post VaR, 99% confidence (parametric)
Modified ex-post VaR, 95% confidence (parametric)
Modified ex-post VaR, 99% confidence (parametric)
Drawdown
Number of drawdowns
Maximum drawdown
Largest individual drawdown
Average drawdown (top 3)
Average drawdown (top 5)
Average drawdown (all)
Average annual maximum drawdown
Pain index
Ulcer index
Partial moments
Downside potential
Downside risk
Upside potential
Upside risk
Semi-variance
Semi-deviation
Omega ratio
Minimum target return
Sortino ratio
Upside potential ratio
Variability skewness
Risk-adjusted return
M-squared
M-squared excess return (geometric or arithmetic)
Differential return
Analytics reference
94 return and risk statistics available for composite reporting, available with the Analytics and Charts component. Where noted, statistics can be calculated on a geometric or arithmetic basis.
Descriptive statistics
Composite return
Benchmark return (up to 4 benchmarks)
Risk-free benchmark return
Number of portfolios in composite, beginning of year
Number of portfolios in composite, end of year
Number of portfolios in composite for entire year
Standard deviation of portfolio returns within composite
Total composite assets
Total firm assets
Percentage of firm assets represented by a composite
High portfolio return within composite
Low portfolio return within composite
Range of portfolio returns within composite
Percent non-fee-paying assets in composite, end of year
Percent bundled-fee assets in composite, end of year
Equal-weighted mean portfolio return, full year
Equal-weighted median portfolio return, full year
Mean monthly composite return
Median monthly composite return
Mean monthly composite absolute deviation
Variance, monthly composite returns
Standard deviation, monthly composite returns
Mean monthly benchmark return
Median monthly benchmark return
Mean monthly benchmark absolute deviation
Variance, monthly benchmark returns
Standard deviation, monthly benchmark returns
Skewness, monthly composite returns
Kurtosis, monthly composite returns
Excess kurtosis, monthly composite returns
Bera-Jarque statistic, monthly composite returns
Skewness, monthly benchmark returns
Kurtosis, monthly benchmark returns
Excess kurtosis, monthly benchmark returns
Bera-Jarque statistic, monthly benchmark returns
Covariance
Correlation
Up capture indicator
Down capture indicator
Up number ratio
Down number ratio
Up percentage ratio
Down percentage ratio
Percentage gain ratio
Composite Hurst index
Benchmark Hurst index
Composite bias ratio
Benchmark bias ratio